Philadelphia Flyers — Washington Capitals: a reliable bet on the NHL match

Philadelphia will meet Washington on its own site in the regular season match of the National Hockey League. LiveResult.Ru gives a forecast for the game.
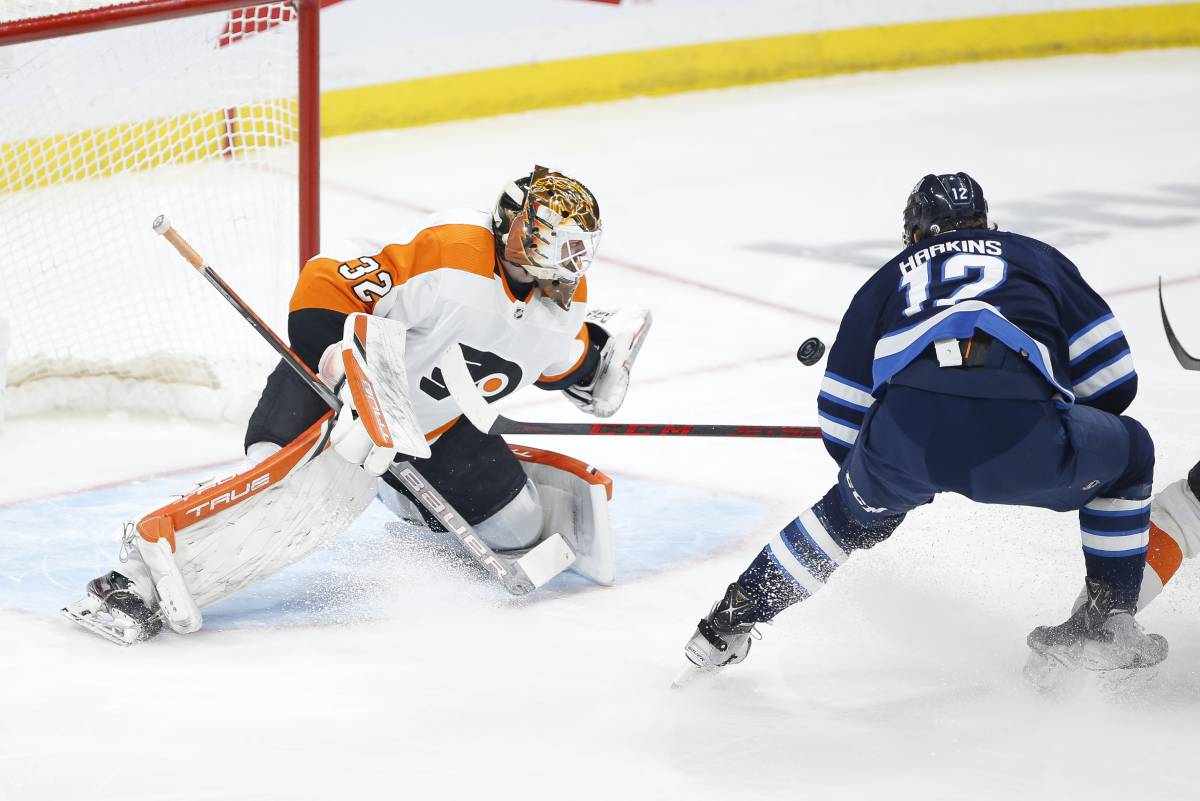
Text

Philadelphia Flyers

The Pilots played the previous match in the regular season on December 6 and beat Colorado 5-3 on their court. With this victory, John Tortorella's team interrupted a mini—series of two defeats. The hosts conceded already in the 4th minute, but not only equalized, but also took the lead even before the siren about the end of the first period. By the middle of the third period, the "pilots" were winning with a difference of three goals and brought the meeting to victory. This season, the Pennsylvania club played 26 games in the regular season and scored 23 points. Philadelphia is currently ranked 14th in the Eastern Conference table.

Washington Capitals

The capital club is located on the 12th line in the East. Washington played the previous match in the regular season in Canada, where they beat local Edmonton with a score of 3:2. Lars Eller, T.J. Oshie and Nick Dowd scored accurate shots as part of the winners. This season, Washington played 27 games in the regular season and scored 26 points. The capital team scored 74 goals — the third result from the end in the conference. Only Philadelphia (64) and Columbus (66) are worse off.

Statistics and figures:

  • Bookmakers consider Washington the favorite of the match.
  • In the last face—to-face meetings, the Capitals won 40 victories, the pilots - 34.
  • The previous game ended with a score of 3:2 in favor of Washington.

Forecast

I will bet on "total less". I believe that the meeting will not be very productive.

Tip: Total less than 6.5
Played
1.75 Make a bet
Все прогнозы на спортивные события, размещенные на сайте не являются индивидуальными рекомендациями. Все риски при совершении ставок пользователи берут на себя. Слова «надёжный», «точный», «верный» и другие применительно к прогнозам отражают только мнение автора и являются фигурой речи, а не конечной оценкой вероятности срабатывания.

Match Progress

First Period
1:0
04:19
11:05
14:16
16:33
19:49
Second Period
0:1

Match statistics

  • 30 Total shots made 27
  • 3.33 Shooting Percentage 14.81
  • 23 Number of goalie saves 29
  • 92 Goalkeeper save percentage 96.67
  • 22 Blocked Goal Attempts 9
  • 26 Total faceoff wins 30
  • 46.43 Faceoffs Percentage 53.57
  • 5 Number of penalties 3
  • 18 Penalty minutes 6
  • 1 Goals made during power play 1
  • 33.33 Powerplay Percentage 20
  • 0 Penalty killing goals 0
  • 80 Penalty Killing Percentage 66.67
  • 0 Empty Net Goals 2
  • 33 Hits 20
  • 4 Giveaways 8
  • 3 Takeaways 9
  • 0 Total goals scored 3
  • 15 Total shots made 11
  • 0 Shooting Percentage 27.27
  • 8 Number of goalie saves 15
  • 88.89 Goalkeeper save percentage 100
  • 5 Blocked Goal Attempts 2
  • 10 Total faceoff wins 10
  • 50 Faceoffs Percentage 50
  • 1 Number of penalties 1
  • 10 Penalty minutes 2
  • 0 Goals made during power play 0
  • 0 Powerplay Percentage 0
  • 0 Penalty killing goals 0
  • 100 Penalty Killing Percentage 100
  • 0 Empty Net Goals 2
  • 10 Hits 8
  • 2 Giveaways 1
  • 0 Takeaways 4
  • 0 Total goals scored 1
  • 8 Total shots made 12
  • 0 Shooting Percentage 8.33
  • 11 Number of goalie saves 8
  • 91.67 Goalkeeper save percentage 100
  • 12 Blocked Goal Attempts 4
  • 7 Total faceoff wins 10
  • 41.18 Faceoffs Percentage 58.82
  • 1 Number of penalties 0
  • 2 Penalty minutes 0
  • 0 Goals made during power play 1
  • 0 Powerplay Percentage 100
  • 0 Penalty killing goals 0
  • 0 Penalty Killing Percentage 100
  • 0 Empty Net Goals 0
  • 8 Hits 9
  • 2 Giveaways 5
  • 0 Takeaways 3
  • 1 Total goals scored 0
  • 7 Total shots made 4
  • 14.29 Shooting Percentage 0
  • 4 Number of goalie saves 6
  • 100 Goalkeeper save percentage 85.71
  • 5 Blocked Goal Attempts 3
  • 9 Total faceoff wins 10
  • 47.37 Faceoffs Percentage 52.63
  • 3 Number of penalties 2
  • 6 Penalty minutes 4
  • 1 Goals made during power play 0
  • 50 Powerplay Percentage 0
  • 0 Penalty killing goals 0
  • 100 Penalty Killing Percentage 50
  • 0 Empty Net Goals 0
  • 15 Hits 3
  • 0 Giveaways 2
  • 3 Takeaways 2
Tip from liveresult

Personal matches history

Philadelphia Flyers
Washington Capitals

34 matches

100%
34 wins 0 wins

First Period

47.1%
35.3%
17.6%
16 wins 12 draws 0 wins

Second Period

85.3%
23.5%
29 wins 8 draws 0 wins

Third Period

61.8%
35.3%
2.9%
21 wins 12 draws 0 wins

Over Time

20.6%
17.6%
61.8%
7 wins 6 draws 0 wins

Shootout

11.8%
88.2%
4 wins 0 draws 0 wins

40 matches

100%
0 wins 40 wins

First Period

45%
55%
0 wins 18 draws 28 wins

Second Period

30%
70%
0 wins 12 draws 25 wins

Third Period

20%
80%
0 wins 8 draws 33 wins

Over Time

10%
90%
0 wins 4 draws 4 wins

Shootout

100%
0 wins 0 draws 6 wins

74 matches

45.9%
54.1%
34 wins 40 wins

First Period

21.6%
40.5%
37.9%
16 wins 30 draws 28 wins

Second Period

39.2%
27%
33.8%
29 wins 20 draws 25 wins

Third Period

28.4%
27%
44.6%
21 wins 20 draws 33 wins

Over Time

9.5%
13.5%
77%
7 wins 10 draws 4 wins

Shootout

5.4%
94.6%
4 wins 0 draws 6 wins

Matches history

N
3:2
N
9:2
N
2:1
N
3:5
N
1:2
N
2:1
N
2:4
N
3:6
N
6:1
N
4:5
N
3:5
N
1:3
N
4:7
NPGE
3:1
N
2:5
N
2:7
N
3:2
N
1:2
N
3:1
N
2:5
N
3:5
N
5:3
N
6:3
N
5:3
N
1:2
N
8:2
N
2:1
N
1:4
N
5:0
N
3:2
N
0:1
N
0:2
N
2:1
N
1:6
N
4:1
N
2:0
N
2:1
N
3:2
N
3:4
N
2:5
N
3:2
N
1:3
N
1:0
N
3:2
N
3:2
N
5:4
N
6:4
N
4:5
N
5:2
N
5:4
N
0:7
N
6:3
N
3:4
N
5:4
N
4:1
N
3:2
N
2:1
N
0:1
N
1:5
N
2:5
N
4:5
N
3:2
N
4:5
N
3:2
N
5:3
N
2:8
N
4:2
N
6:5
N
1:2
N
2:4
N
2:1
N
7:1
N
5:1
N
2:1

Total Goals

116
93

Average goals per match

3.05
2.58

Average time per goal

20:55
24:16

Total Goals

113
125

Average goals per match

3.14
3.29

Average time per goal

20:22
18:41

Total Goals

229
218

Average goals per match

3.09
2.95

Matches total

71
More 96%
Less 4%
3
62
More 84%
Less 16%
12
57
More 77%
Less 23%
17
47
More 64%
Less 36%
27
39
More 53%
Less 47%
35
32
More 43%
Less 57%
42
24
More 32%
Less 68%
50
12
More 16%
Less 84%
62
6
More 8%
Less 92%
68
2
More 3%
Less 97%
72

Average time per goal

20:39
21:02

Scorers inside tournament

Philadelphia Flyers
Player Goal+Pass Average per match
Travis Konecny 31+30 0.38
Kevin Hayes 18+36 0.22
Owen Tippett 27+22 0.33
Morgan Frost 19+27 0.23
Scott Laughton 18+25 0.22
Anthony DeAngelo 11+31 0.15
Joel Farabee 15+24 0.18
Noah Cates 13+25 0.16
James van Rimsdajk 12+17 0.15
Ivan Provorov 6+21 0.07
Travis Sanheim 7+16 0.09
Cam York 2+18 0.04
Rasmus Ristolainen 3+17 0.04
Wade Allison 9+6 0.11
Nick Seeler 4+10 0.05
Nicolas Deslauriers 6+6 0.07
Zack MacEwen 4+5 0.07
Lukas Sedlak 3+5 0.11
Patrick Brown 2+5 0.03
Tyson Foerster 3+4 0.38
Brendan Lemieux 2+4 0.1
Tanner Laczynski 2+2 0.03
Egor Zamula 0+4 -
Kieffer Bellows 3 0.11
Justin Brown 0+2 -
Olle Lycksell 0+1 -
Washington Capitals
Player Goal+Pass Average per match
Alexander Ovechkin 42+33 0.51
Dylan Strome 23+42 0.28
Evgeny Kuznetsov 12+43 0.15
Erik Gustafsson II 7+31 0.11
Conor Sheary 15+22 0.18
T.J. Oshie 19+16 0.23
Sonny Milano 11+22 0.16
Nick Jensen 5+24 0.06
John Carlson 9+20 0.11
Markus Johansson 13+15 0.2
Antony Mantha 11+16 0.15
Nick Dowd 13+12 0.16
Trevor van Riemsdyk 7+16 0.09
Tom Wilson 13+9 0.16
Niklas Oskar Bäckström 7+14 0.09
Dmitry Orlov 3+16 0.05
Garnet Hathaway 9+7 0.15
Martin Fehervary 6+10 0.07
Lars Eller 7+9 0.12
Alexei Protas 4+11 0.07
Rasmus Sandin 3+12 0.12
Nicolas Aube-Kubel 4+8 0.08
Craig Smith 5+1 0.2
Aleksandr Alekseev 0+5 -
Matt Irwin 2+3 0.03
Joe Snively 2+2 0.17
Gabriel Carlsson 0+2 -
Beck Malenstyn 1+1 0.03
Dylan McIlrath 0+1 -
Vincent Iorio 0+1 -
Charlie Lindgren 0+1 -

Penalties

Philadelphia Flyers
Player Penalties Average per match
Nicolas Deslauriers 136' (31) 1.68'
Travis Konecny 77' (29) 0.94'
Anthony DeAngelo 73' (20) 1'
Nick Seeler 56' (22) 0.72'
Zack MacEwen 54' (18) 0.9'
Scott Laughton 50' (21) 0.61'
Joel Farabee 43' (17) 0.52'
Travis Sanheim 40' (20) 0.49'
Wade Allison 36' (11) 0.44'
Rasmus Ristolainen 32' (16) 0.4'
James van Rimsdajk 28' (14) 0.34'
Ivan Provorov 24' (12) 0.29'
Morgan Frost 24' (12) 0.3'
Kevin Hayes 23' (10) 0.28'
Brendan Lemieux 21' (5) 1'
Justin Brown 19' (8) 0.37'
Cam York 18' (9) 0.33'
Patrick Brown 17' (7) 0.28'
Owen Tippett 16' (8) 0.2'
Noah Cates 12' (6) 0.15'
Lukas Sedlak 12' (6) 0.44'
Tyson Foerster 8' (4) 1'
Olle Lycksell 8' (4) 1'
Kieffer Bellows 6' (3) 0.21'
Max Willman 4' (2) 0.31'
Tanner Laczynski 2' (1) 0.03'
Egor Zamula 2' (1) 0.14'
Adam Ginning 2' (1) 2'
Washington Capitals
Player Penalties Average per match
Tom Wilson 78' (25) 0.98'
T.J. Oshie 59' (21) 0.73'
Evgeny Kuznetsov 56' (28) 0.68'
Garnet Hathaway 52' (19) 0.85'
Alexander Ovechkin 50' (21) 0.61'
Nicolas Aube-Kubel 41' (15) 0.8'
Lars Eller 36' (18) 0.6'
Matt Irwin 36' (12) 0.59'
Antony Mantha 31' (11) 0.41'
Martin Fehervary 31' (14) 0.38'
Nick Dowd 26' (13) 0.32'
Dylan Strome 24' (12) 0.3'
Conor Sheary 22' (11) 0.27'
Erik Gustafsson II 21' (9) 0.34'
Sonny Milano 18' (9) 0.26'
Nick Jensen 18' (9) 0.22'
Rasmus Sandin 16' (5) 0.64'
Trevor van Riemsdyk 15' (6) 0.18'
Niklas Oskar Bäckström 14' (7) 0.18'
John Carlson 12' (6) 0.15'
Alexei Protas 12' (6) 0.2'
Dmitry Orlov 10' (5) 0.17'
Markus Johansson 8' (4) 0.13'
Dylan McIlrath 7' (2) 1.17'
Connor McMichael 5' (1) 0.83'
Craig Smith 4' (2) 0.16'
Aleksandr Alekseev 4' (2) 0.11'
Darcy Kuemper 4' (2) 0.05'
Beck Malenstyn 2' (1) 0.06'

Match results

Philadelphia Flyers
43.9%
56.1%
18 wins 23 losses
First Period
22% (9)
41% (17)
37% (15)
 
Wins
Draws
Defeats
Second Period
39% (16)
27% (11)
34% (14)
Third Period
32% (13)
32% (13)
37% (15)
 
Wins
Draws
Defeats
Over Time
2% (1)
85% (35)
12% (5)
Washington Capitals
56.1%
43.9%
23 wins 18 losses
First Period
29% (12)
34% (14)
37% (15)
 
Wins
Draws
Defeats
Second Period
32% (13)
29% (12)
39% (16)
Third Period
41% (17)
27% (11)
32% (13)
 
Wins
Draws
Defeats
Over Time
12% (5)
83% (34)
5% (2)

Dry wins

1
1

Dry defeats

1
2

Volitional Victories

9
13

Lost wins

7
12
Philadelphia Flyers
68.3%
31.7%
28 wins 13 losses
First Period
41% (17)
39% (16)
20% (8)
 
Wins
Draws
Defeats
Second Period
44% (18)
22% (9)
34% (14)
Third Period
37% (15)
34% (14)
29% (12)
 
Wins
Draws
Defeats
Over Time
17% (7)
78% (32)
5% (2)
Washington Capitals
41.5%
58.5%
17 wins 24 losses
First Period
29% (12)
29% (12)
41% (17)
 
Wins
Draws
Defeats
Second Period
39% (16)
27% (11)
34% (14)
Third Period
37% (15)
17% (7)
46% (19)
 
Wins
Draws
Defeats
Over Time
10% (4)
88% (36)
2% (1)

Dry wins

5
3

Dry defeats

2
1

Volitional Victories

20
8

Lost wins

8
6
Philadelphia Flyers
56.1%
43.9%
46 wins 36 losses
First Period
32% (26)
40% (33)
28% (23)
 
Wins
Draws
Defeats
Second Period
41% (34)
24% (20)
34% (28)
Third Period
34% (28)
33% (27)
33% (27)
 
Wins
Draws
Defeats
Over Time
10% (8)
82% (67)
9% (7)
Washington Capitals
48.8%
51.2%
40 wins 42 losses
First Period
29% (24)
32% (26)
39% (32)
 
Wins
Draws
Defeats
Second Period
35% (29)
28% (23)
37% (30)
Third Period
39% (32)
22% (18)
39% (32)
 
Wins
Draws
Defeats
Over Time
11% (9)
85% (70)
4% (3)

Dry wins

6
4

Dry defeats

3
3

Volitional Victories

29
21

Lost wins

15
18

Goals by match time

Scored

121
127
30 In the 1st period 34
51 In the 2nd period 48
39 In the 3rd period 43
1 In overtime 2
16 Scored first 22
42 Not scored 42
30
25%
34
27%
FP
51
42%
48
38%
SP
39
32%
43
34%
TP
1
1%
2
2%
OT

Missed

136
125
43 In the 1st period 29
41 In the 2nd period 46
47 In the 3rd period 45
5 In overtime 5
25 Missed first 19
40 Not missed 39
43
32%
29
23%
FP
41
30%
46
37%
SP
47
35%
45
36%
TP
5
4%
5
4%
OT
Philadelphia Flyers
Washington Capitals
3 Average goals per match 3
11:15 Average minute of first goal 12:16
40 Both teams scored 39
20:30 Average time per goal 19:40

Scored

99
126
29 In the 1st period 28
29 In the 2nd period 48
39 In the 3rd period 46
2 In overtime 4
16 Scored first 15
46 Not scored 42
29
29%
29%
28
22%
FP
29
29%
29%
48
38%
SP
39
39%
46
37%
TP
2
2%
4
3%
OT

Missed

140
136
39 In the 1st period 41
44 In the 2nd period 46
50 In the 3rd period 48
7 In overtime 1
25 Missed first 26
39 Not missed 38
39
28%
41
30%
FP
44
31%
46
34%
SP
50
36%
48
35%
TP
7
5%
1
1%
OT
Philadelphia Flyers
Washington Capitals
2 Average goals per match 3
11:42 Average minute of first goal 10:43
39 Both teams scored 40
25:21 Average time per goal 20:09

Scored

220
253
59 In the 1st period 62
80 In the 2nd period 96
78 In the 3rd period 89
3 In overtime 6
32 Scored first 37
6 Not scored 2
59
27%
62
25%
FP
80
36%
96
38%
SP
78
35%
89
35%
TP
3
1%
6
2%
OT

Missed

276
261
82 In the 1st period 70
85 In the 2nd period 92
97 In the 3rd period 93
12 In overtime 6
50 Missed first 45
79 Not missed 77
82
30%
30%
70
27%
FP
85
31%
92
35%
SP
97
35%
93
36%
TP
12
4%
6
2%
OT
Philadelphia Flyers
Washington Capitals
3 Average goals per match 3
11:29 Average minute of first goal 11:29
79 Both teams scored 79
22:40 Average time per goal 19:55

Results of the last matches

Match results

Philadelphia Flyers
Washington Capitals

Exact score

1:4
5 times 12%
3:5
3 times 7%
5:3
3 times 7%
5:2
3 times 7%
3:3
3 times 7%
3:2
2 times 5%
2:5
2 times 5%
4:4
2 times 5%
3:1
2 times 5%
1:1
2 times 5%
3:6
2 times 5%
6:2
1 time 2%
5:1
1 time 2%
4:3
1 time 2%
0:3
1 time 2%
3:4
1 time 2%
3:0
1 time 2%
2:6
1 time 2%
2:3
1 time 2%
2:2
1 time 2%
1:5
1 time 2%
1:2
1 time 2%
6:3
1 time 2%
2:2
4 times 10%
4:4
3 times 7%
2:3
3 times 7%
2:4
3 times 7%
2:5
3 times 7%
3:3
2 times 5%
1:3
2 times 5%
1:4
2 times 5%
5:2
2 times 5%
4:1
2 times 5%
6:6
1 time 2%
6:4
1 time 2%
6:3
1 time 2%
6:1
1 time 2%
5:4
1 time 2%
5:1
1 time 2%
0:4
1 time 2%
4:3
1 time 2%
3:6
1 time 2%
1:0
1 time 2%
3:1
1 time 2%
3:0
1 time 2%
1:2
1 time 2%
1:1
1 time 2%
9:2
1 time 2%

Exact number of goals

3
14 times 34%
1
9 times 22%
5
7 times 17%
2
5 times 12%
4
3 times 7%
6
2 times 5%
0
1 time 2%
2
13 times 32%
1
7 times 17%
4
6 times 15%
3
5 times 12%
5
4 times 10%
6
4 times 10%
0
1 time 2%
9
1 time 2%

Exact score

4:4
5 times 12%
5:2
4 times 10%
1:2
3 times 7%
4:2
3 times 7%
4:1
2 times 5%
6:2
2 times 5%
1:3
2 times 5%
2:2
2 times 5%
4:3
2 times 5%
0:4
2 times 5%
0:0
1 time 2%
6:5
1 time 2%
6:0
1 time 2%
5:1
1 time 2%
3:4
1 time 2%
4:0
1 time 2%
3:3
1 time 2%
3:2
1 time 2%
2:4
1 time 2%
2:3
1 time 2%
1:4
1 time 2%
1:1
1 time 2%
1:0
1 time 2%
7:0
1 time 2%
2:2
4 times 10%
5:2
4 times 10%
5:3
3 times 7%
5:1
3 times 7%
6:2
2 times 5%
1:5
2 times 5%
3:2
2 times 5%
3:3
2 times 5%
0:4
2 times 5%
0:3
1 time 2%
4:1
1 time 2%
6:3
1 time 2%
4:4
1 time 2%
4:3
1 time 2%
4:2
1 time 2%
3:6
1 time 2%
3:8
1 time 2%
3:7
1 time 2%
3:1
1 time 2%
2:6
1 time 2%
2:5
1 time 2%
2:3
1 time 2%
2:0
1 time 2%
1:4
1 time 2%
1:2
1 time 2%
7:4
1 time 2%

Exact number of goals

2
15 times 37%
4
10 times 24%
3
6 times 15%
0
5 times 12%
1
4 times 10%
5
1 time 2%
2
14 times 34%
3
9 times 22%
1
5 times 12%
4
5 times 12%
5
3 times 7%
6
2 times 5%
0
1 time 2%
7
1 time 2%
8
1 time 2%

Exact score

5:2
7 times 9%
4:4
7 times 9%
1:4
6 times 7%
3:3
4 times 5%
1:2
4 times 5%
6:2
3 times 4%
4:2
3 times 4%
3:5
3 times 4%
3:2
3 times 4%
5:3
3 times 4%
4:3
3 times 4%
1:1
3 times 4%
2:2
3 times 4%
2:3
2 times 2%
3:1
2 times 2%
1:3
2 times 2%
3:4
2 times 2%
3:6
2 times 2%
5:1
2 times 2%
4:1
2 times 2%
0:4
2 times 2%
2:5
2 times 2%
6:0
1 time 1%
6:3
1 time 1%
6:5
1 time 1%
0:0
1 time 1%
4:0
1 time 1%
0:3
1 time 1%
3:0
1 time 1%
2:6
1 time 1%
2:4
1 time 1%
1:5
1 time 1%
1:0
1 time 1%
7:0
1 time 1%
2:2
8 times 10%
5:2
6 times 7%
5:1
4 times 5%
4:4
4 times 5%
3:3
4 times 5%
2:3
4 times 5%
2:5
4 times 5%
5:3
3 times 4%
4:1
3 times 4%
1:4
3 times 4%
0:4
3 times 4%
2:4
3 times 4%
3:2
2 times 2%
4:3
2 times 2%
3:6
2 times 2%
3:1
2 times 2%
6:2
2 times 2%
1:5
2 times 2%
1:3
2 times 2%
1:2
2 times 2%
6:3
2 times 2%
6:4
1 time 1%
6:1
1 time 1%
5:4
1 time 1%
6:6
1 time 1%
7:4
1 time 1%
0:3
1 time 1%
4:2
1 time 1%
3:8
1 time 1%
3:7
1 time 1%
3:0
1 time 1%
2:6
1 time 1%
2:0
1 time 1%
1:1
1 time 1%
1:0
1 time 1%
9:2
1 time 1%

Exact number of goals

2
20 times 24%
3
20 times 24%
1
13 times 16%
4
13 times 16%
5
8 times 10%
0
6 times 7%
6
2 times 2%
2
27 times 33%
3
14 times 17%
1
12 times 15%
4
11 times 13%
5
7 times 9%
6
6 times 7%
0
2 times 2%
7
1 time 1%
8
1 time 1%
9
1 time 1%

Total goals in a match

Philadelphia Flyers
Washington Capitals

Average total

3
Whole match
3.1
0.7
In the 1st period
0.8
1.2
In the 2nd period
1.2
1
In the 3rd period
1
0.1
In overtime
0.2

Individual Totals

More Less
31
10
1.5
More Less
33
8
26
15
2.5
20
21
12
29
3.5
15
26
9
32
4.5
9
32
2
39
5.5
5
36
0
41
6.5
1
40
0
41
7.5
1
40

Average total

2.4
Whole match
3.1
0.7
In the 1st period
0.7
0.7
In the 2nd period
1.2
1
In the 3rd period
1.1
0.2
In overtime
0.6

Individual Totals

More Less
32
9
1.5
More Less
35
6
17
24
2.5
21
20
11
30
3.5
12
29
1
40
4.5
7
34
0
41
5.5
4
37
0
41
6.5
2
39
0
41
7.5
1
40

Average total

2.7
Whole match
3.1
0.7
In the 1st period
0.8
1
In the 2nd period
1.2
1
In the 3rd period
1.1
0.2
In overtime
0.3

Individual Totals

More Less
63
19
1.5
More Less
68
14
43
39
2.5
41
41
23
59
3.5
27
55
10
72
4.5
16
66
2
80
5.5
9
73
0
82
6.5
3
79
0
82
7.5
2
80

Западная конференция

Team Prev. matches G W WO DO D Goals P
1. Squad 82 38 13 9 22 272 - 229 111
2. Squad 82 45 5 9 23 325 - 260 109
3. Squad 82 36 15 7 24 280 - 226 109
4. Squad 82 39 8 14 21 285 - 218 108
5. Squad 82 37 10 10 25 280 - 257 104
6. Squad 82 34 12 11 25 246 - 225 103
7. Squad 82 37 9 8 28 289 - 256 100
8. Squad 82 36 10 3 33 247 - 225 95
9. Squad 82 31 7 17 27 260 - 252 93
10. Squad 82 29 13 8 32 229 - 238 92
11. Squad 82 24 14 7 37 276 - 298 83
12. Squad 82 27 10 7 38 263 - 301 81
13. Squad 82 20 8 14 40 228 - 299 70
14. Squad 82 16 6 16 44 234 - 321 60
15. Squad 82 18 8 7 49 204 - 301 59
16. Squad 82 13 10 12 47 209 - 338 58

Восточная конференция

Team Prev. matches G W WO DO D Goals P
1. Squad 82 54 11 5 12 305 - 177 135
2. Squad 82 39 13 9 21 266 - 213 113
3. Squad 82 39 13 8 22 291 - 226 112
4. Squad 82 42 8 11 21 279 - 222 111
5. Squad 82 37 10 13 22 277 - 219 107
6. Squad 82 38 8 6 30 283 - 254 98
7. Squad 82 36 6 9 31 243 - 222 93
8. Squad 82 36 6 8 32 290 - 273 92
9. Squad 82 31 9 11 31 262 - 264 91
10. Squad 82 30 12 7 33 296 - 300 91
11. Squad 82 31 8 8 35 261 - 271 86
12. Squad 82 28 7 10 37 240 - 279 80
13. Squad 82 27 8 10 37 255 - 265 80
14. Squad 82 26 5 13 38 222 - 277 75
15. Squad 82 21 10 6 45 232 - 307 68
16. Squad 82 15 10 9 48 214 - 330 59

Западная конференция

Team Prev. matches G W WO DO D Goals P
1. Squad 41 22 4 4 11 148 - 121 56
2. Squad 41 22 4 2 13 132 - 103 54
3. Squad 41 16 9 4 12 123 - 112 54
4. Squad 41 18 4 9 10 142 - 115 53
5. Squad 41 19 4 6 12 159 - 126 52
6. Squad 41 19 6 1 15 133 - 116 51
7. Squad 41 18 4 6 13 137 - 112 50
8. Squad 41 15 7 4 15 117 - 117 48
9. Squad 41 13 8 5 15 130 - 142 47
10. Squad 41 17 3 5 16 127 - 126 45
11. Squad 41 16 4 4 17 137 - 127 44
12. Squad 41 12 6 6 17 130 - 145 42
13. Squad 41 13 6 2 20 133 - 143 40
14. Squad 41 8 6 4 23 115 - 155 32
15. Squad 41 5 7 4 25 105 - 167 28
16. Squad 41 6 2 11 22 114 - 169 27

Восточная конференция

Team Prev. matches G W WO DO D Goals P
1. Squad 41 28 6 3 4 145 - 74 71
2. Squad 41 25 3 5 8 165 - 108 61
3. Squad 41 22 5 6 8 147 - 105 60
4. Squad 41 23 5 3 10 137 - 103 59
5. Squad 41 22 3 3 13 126 - 94 53
6. Squad 41 18 6 4 13 137 - 107 52
7. Squad 41 20 4 3 14 152 - 124 51
8. Squad 41 20 3 5 13 153 - 125 51
9. Squad 41 18 5 5 13 141 - 116 51
10. Squad 41 17 6 5 13 143 - 128 51
11. Squad 41 17 2 5 17 125 - 137 43
12. Squad 41 14 4 7 16 129 - 127 43
13. Squad 41 15 3 5 18 123 - 136 41
14. Squad 41 12 5 4 20 145 - 164 38
15. Squad 41 11 6 3 21 123 - 152 37
16. Squad 41 9 7 2 23 114 - 160 34

Западная конференция

Team Prev. matches G W WO DO D Goals P
1. Squad 41 19 7 8 7 139 - 113 60
2. Squad 41 18 11 1 11 143 - 114 59
3. Squad 41 26 1 3 11 166 - 134 57
4. Squad 41 21 5 4 11 152 - 129 56
5. Squad 41 21 4 5 11 143 - 103 55
6. Squad 41 18 3 7 13 123 - 113 49
7. Squad 41 15 6 6 14 132 - 136 48
8. Squad 41 14 4 12 11 133 - 126 48
9. Squad 41 14 6 4 17 112 - 121 44
10. Squad 41 11 8 5 17 143 - 155 43
11. Squad 41 14 6 1 20 115 - 122 41
12. Squad 41 15 4 1 21 133 - 156 39
13. Squad 41 10 4 5 22 120 - 152 33
14. Squad 41 8 3 8 22 104 - 171 30
15. Squad 41 10 2 3 26 89 - 146 27
16. Squad 41 7 0 9 25 98 - 157 23

Восточная конференция

Team Prev. matches G W WO DO D Goals P
1. Squad 41 26 5 2 8 160 - 103 64
2. Squad 41 21 7 4 9 154 - 119 60
3. Squad 41 19 5 8 9 136 - 103 56
4. Squad 41 16 8 6 11 129 - 110 54
5. Squad 41 18 7 3 13 151 - 136 53
6. Squad 41 20 3 5 13 132 - 117 51
7. Squad 41 16 3 3 19 137 - 148 41
8. Squad 41 14 3 6 18 117 - 128 40
9. Squad 41 14 3 6 18 119 - 136 40
10. Squad 41 13 4 3 21 126 - 138 37
11. Squad 41 13 5 1 22 118 - 146 37
12. Squad 41 11 5 5 20 115 - 142 37
13. Squad 41 11 4 5 21 109 - 147 35
14. Squad 41 11 2 8 20 99 - 141 34
15. Squad 41 10 4 3 24 109 - 155 31
16. Squad 41 6 3 7 25 100 - 170 25
  • — Выход в плей-офф

Top Forwarders

Edm Oilers Connor McDavid 173 (101)
Edm Oilers Leon Draisaitl 146 (81)
Florida Panthers Matthew Tkachuk 133 (82)
Dal Stars Jason Robertson 127 (74)
Tampa Bay Lightning Nikita Kucherov 119 (88)

Top Violators

Florida Panthers Matthew Tkachuk 197 54
Tampa Bay Lightning Patrick Maroon 168 42
Florida Panthers Brandon Montour 146 42
Philadelphia Flyers Nicolas Deslauriers 136 31
Ottawa Senators Brady Tkachuk 134 43
Tip from liveresult

Please, register or login, to take part in the contest!

✅ Football tips
 
Betting bonus